Fuel Cell White Paper
Fuel Cell Technology
Applied to Alcohol Breath Testing
Intoximeters, Inc.
2081 Craig Road
St. Louis, Missouri 63146, USA
(314) 429-4000
(800) 451-8639 (USA and Canada Only)
© 2013 Intoximeters, Inc.
THE NEED FOR BLOOD ALCOHOL TESTING
In the 19th century, law enforcement officials dealt with the problem of alcohol abusers by imprisoning them until they were sober. In the 20th century, the advent of high-speed transportation and complex machinery gave high priority to alcohol testing and screening. Automobiles traveling at 90 feet per second on the freeway are unforgiving of drivers with alcohol impairment. The same is true for a 300-passenger aircraft guided by an alcohol-impaired pilot attempting to land under minimum-visibility conditions. There is very little margin for error. People who operate complex equipment with their judgment impaired by alcohol may not only be a danger to themselves, but impact the safety of others.
Until recently, the main application of alcohol testing was to traffic law enforcement. The intent was to identify people suspected of driving under the influence of alcohol and remove them from the road. After arrest, law enforcement officers gave the subject a chemical test to determine his blood alcohol level. Subjects were either released or incarcerated and prosecuted, depending on what alcohol levels were illegal as dictated by state law. Until the mid-1940’s, the primary means of measuring blood alcohol levels involved either blood or urine sample testing, both of which were time-consuming and expensive procedures. In the late 1940’s, alcohol breath testing replaced blood and urine sample testing as a means of screening subjects and producing evidentiary results for prosecution..
In the 1980’s, railroad, nuclear, Department of Defense, and maritime employees came under Federally-mandated testing requirements. In each case, new laws followed a major, alcohol-related disaster. In 1991, the United States Congress passed the Omnibus Transportation Employee Testing Act. This legislation mandated alcohol testing for transportation personnel involved in safety-sensitive jobs. This mandate included airline pilots and cabin attendants, truck drivers, railroad crews, and gas pipeline workers. The U.S. Department of Transportation further defined unacceptable maximum alcohol levels.
CURRENT ALCOHOL MEASUREMENT TECHNOLOGY
Infrared Technology Since the mid-1980s, infrared (IR) technology has been the primary means of breath alcohol testing in the United States. Current technology uses infrared measurement systems that are made more specific for alcohol by using several optical filters. You determine breath alcohol levels by passing a narrow band of IR light, selected for its absorption by alcohol, through one side of a breath sample chamber. By detecting emergent light on the other side, you can measure alcohol concentration by using the well-known Lambert-Beers law, which defines the relationship between concentration and IR absorption. A major advantage of this technology is its ability to make real-time measurements.
One disadvantage of using IR technology is the high cost of achieving specificity and accuracy at low breath alcohol concentration levels. Also, the IR detector’s output is nonlinear with respect to alcohol concentration.
Because of IR technology’s expense, mechanical components, and other limitations, breath alcohol instrumentation manufacturers began a search for an alternative. One technology, electrochemical cells, also known as fuel cells, seemed to offer significant advantages.
Fuel Cell Technology
History
In the early 1800’s a British scientist discovered the fuel cell effect. He immersed two platinum electrodes in sulfuric acid electrolyte and supplied hydrogen at one electrode and oxygen at the other. The resulting reaction created a current flow between the electrodes. There was no practical application of fuel cells at that time because of high cost and technological problems. In the 1960s, researchers at the University of Vienna demonstrated a fuel cell that was specific for alcohol. This evolved into the present-day cell used in all fuel cell-based breath alcohol measurement instruments.
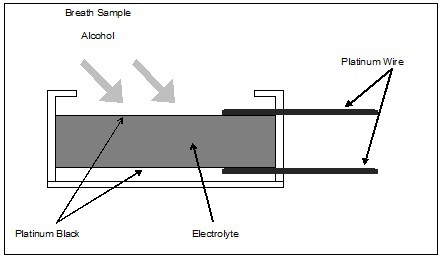
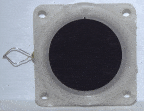
In its simplest form, the alcohol fuel cell consists of a porous, chemically inert layer coated on both sides with finely divided platinum oxide (called platinum black). The manufacturer impregnates the porous layer with an acidic electrolyte solution, and applies platinum wire electrical connections to the platinum black surfaces. The manufacturer mounts the entire assembly in a plastic case, which also includes a gas inlet that allows a breath sample to be introduced. Various manufacturers employ numerous proprietary nuances in their construction. The basic configuration, however, follows that described above and illustrated below in Figure 1.

Figure 1. Fuel Cell Construction
 The exact chemistry of the reaction that takes place in an alcohol fuel cell is open to some conjecture. Researchers assume that the reaction converts alcohol to acetic acid. In the process, this conversion produces two free electrons per molecule of alcohol. This reaction takes place on the upper surface of the fuel cell. H+ ions are freed in the process, and migrate to the lower surface of the cell, where they combine with atmospheric oxygen to form water, consuming one electron per H+ ion in the process. Thus, the upper surface has an excess of electrons, and the lower surface has a corresponding deficiency of electrons. If you connect the two surfaces electrically, a current flows through this external circuit to neutralize the charge. This current is a direct indication of the amount of alcohol oxidized by the fuel cell. With appropriate signal processing, you can display breath alcohol concentrations directly.
Application To Breath Alcohol Measurement
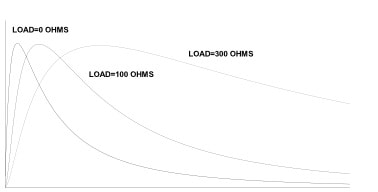
Since the commercial introduction of fuel cell instruments in the mid-1970s, manufacturers improved them continuously. Many of the early problems that limited their use to non-evidential alcohol breath testing have been eliminated. By 1980, modern counterparts of early units were certified for evidential use by the U.S. Department of Transportation, and by a number of state agencies and foreign governments. The fuel cell has established a reputation for specificity and linearity of response over the complete range of alcohol concentration expected in a human breath sample. (This range is from 0 ppm to 900 ppm or its equivalent in other units of measurement). When you introduce a precise volume of a breath sample onto a fuel cell, the output current from the cell rises from zero to a peak, and then ultimately decays back to zero. The rate at which this happens is highly dependent on the load resistor across the output terminals of the sensor. Figure 2 illustrates this effect. Traditionally, measurement instruments used fuel cells with load resistors of several hundred to one thousand ohms. Measurement instruments used the height of the voltage peak across the resistor as the measure of alcohol content of the sample. The Intoximeters, Inc. Alco-Sensor III uses a peak measurement technique. Although this technique produces good linearity, the time to complete conversion of alcohol to electric current increases because of the load resistance of the measurement circuit.
 Figure 2. Fuel Cell Output vs. Time with Various Load Resistors
Measurement Principles
By modifying the design of its fuel cells to speed up the time to peak and by integrating the output signal, Intoximeters enhanced the fuel cell’s analytic capability greatly. The distinct advantages of this new design are:
- Better accuracy when a number of measurements are made in a short period of time,
- Better recovery of the cell to original values after a period of intense usage,
- Better long-term stability of calibration, and
- Excellent linearity with respect to sample concentration. See Figure 4.
Breath Sampling
For breath alcohol measurement, it is critical that you obtain a deep breath sample having a fixed volume. In the past, most instruments using fuel cells introduced a sample across the fuel cell by drawing this sample through a small port connected to a pump mechanism. This invariably allowed some alcohol to bypass the fuel cell chamber and enter the pump itself. The exact amount of alcohol bypassed depended on the rate of absorption of alcohol by the fuel cell, the speed of the pump stroke, and the temperature at which the measurement was made. In addition, unless you used a check valve system, the alcohol remaining in the pump flowed back into the fuel cell when the operator reset the instrument. This extended the time required for the cell to clean up for the next measurement. Intoximeters’ research staff designed a unique mechanism for its evidential fuel cell instruments (Alco-Sensor III, Alco-Sensor IV, Alco-Sensor FST, Alco-Sensor VXL and the Alcomonitor and EC/IR product lines). The pumps used in Intoximeters’ fuel cell instruments employ a piston as one wall of the measuring chamber. All alcohol drawn in by the sampling stroke is continuously exposed to the fuel cell surface; none of the variables mentioned previously have an effect on the sample being analyzed. This technique gives a sample volume that is reproducible to better than ±0.3%. By using a short stroke piston operating between two mechanical stops, sampling is extremely quick and reproducible. The small space between the piston and the fuel cell keeps the alcohol in proximity to the fuel cell surface for fast response.
Fuel Cell Output Measurement Improvements
By 1986, the development of the fuel cell seemed to have reached a plateau. In spite of continuous effort by manufacturers, further improvements in linearity, memory effect, and recovery were elusive. Intoximeters’ research staff decided that they should investigate other ways of analyzing fuel cell output signals.
Previously, instruments relied on the peak fuel cell output as a measurement of the quantity of alcohol analyzed. This worked very well, but with two constraints:
1. The number of positive samples analyzed in rapid succession had to be strictly limited. Successive readings might be in error as peak fuel cell output decreased because of the time required for the cell to complete the alcohol conversion reaction. This could conceivably give readings beyond the acceptable limits for evidential measurement. In a typical unit, ten successive measurements of 0.100 gm/dl gas at 3 minutes between readings might result in the tenth reading being 0.095 or 0.094. To maintain evidential accuracy, the instrument’s operating instructions called for no more than five positive tests per hour. This restriction maintained the quality of results, but was satisfactory only in those situations that required a relatively small number of tests. Some jurisdictions required two tests per subject. A third test could be required if the first two differed by more than a given amount, and then a test reading on a standard to check calibration. In this case, only one subject could be tested per hour with evidential accuracy.
In addition, once the fuel cell output had decreased due to repeated testing, an extended period of time (up to 16 to 24 hours) was required before the cell fully recovered its initial output.
2. The fuel cell used in the conventional mode with a load resistor was very linear up to alcohol levels of about 0.150 gm/dl. Above this level, the cell would read 2-3% low at 0.200, and 5-6% low at 0.300. This was of very little practical significance where legal maximum blood alcohol levels were fixed at 0.100 or 0.080, but it was a subject of criticism.
In early 1986, Intoximeters started an investigation of fuel cell output measurement. This investigation focused on the supposition that the entire signal from the fuel cell, rather than just the peak value, might be useful. The integrated output might contain enough information so that when the signal was analyzed properly, the effects of memory and high alcohol level nonlinearity might be minimized. Table 1 shows the results of a study made by Intoximeters engineers early in 1994. While the peak value varies by 13%, the calibrated fuel cell output integral remains constant. The investigators used a compressed gas standard with 0.100 ethanol concentration. The investigators made tests 3 minutes apart, at an ambient temperature of 23ºC. Figure 3 shows curves illustrating the variation in peak value.
Table 1. Normalized Peak Value vs. Calibrated Integral
| Peak Value | Integral |
|---|---|
| 0.100 | 0.1009 |
| 0.0971 | 0.1008 |
| 0.0950 | 0.1006 |
| 0.0934 | 0.1004 |
| 0.0921 | 0.1010 |
| 0.0909 | 0.1009 |
| 0.0899 | 0.1008 |
| 0.0889 | 0.1006 |
| 0.0881 | 0.1004 |
| 0.0873 | 0.1004 |
 Figure 3. Peak Values of Fuel Cell Output
The integration method used on the Alco-Sensor IV, Alco-Sensor FST, Alco-Sensor VXL, AlcoMonitor CC, and Intox EC/IR II grew out of several years of intensive investigation. Referring to Figure 2, the fastest response from a fuel cell occurs when the output leads of the cell are essentially short-circuited. In this case, the instrument measures current flow rather than voltage. With this configuration, cell output peaks in 2-5 seconds. Typically, output returns to zero by the time that a cell with a 300-ohm resistor across the output is reaching its peak value. In this mode, however, the fall-off in peak values from test to test is much worse than in the mode with a resistor. If you integrate the entire area under the curve, however, you virtually eliminate the slump in reading (Figure 3) from test to test. Because the cell has already returned to zero output, it is ready for another test without an additional waiting period for cleanup (completion of reaction). The readings also recover much more quickly after a series of tests. For practical purposes, the number of tests per hour is limited by the recycling time of the test instrument and test protocols rather than the performance of the fuel cell. Research also established that a cell used in this mode was capable of linear response out to 0.400 gm/dl with an error no greater than 2%. In addition, the linearity of the cell that was notable up to 0.150 gm/dl in the conventional system, is preserved out to 0.400 gm/dl or more. Figure 4 is a family of typical curves representing fuel cell output at four different alcohol vapor concentrations.
Alco-Sensor FST Measurements
| Simulated BAC | 0.020 | 0.040 | 0.080 | 0.160 |
| Mean of 10 Readings | 0.0209 | 0.0421 | 0.0816 | 0.1600 |
| Standard Deviation | 0.000568 | 0.000568 | 0.000966 | 0.000816 |
 Figure 4. Fuel Cell Output As a Function of Alcohol Concentration
Accuracy at Low Breath Alcohol Concentrations
Studies made by the Transportation Research Board concluded that blood alcohol concentrations (BAC) below 0.050% may impair driving-related skills. This caused law enforcement officers some concern about the accuracy of evidential breath test instruments at low levels. To address this concern, the National Highway Transportation Safety Administration (NHTSA) conducted tests on seven models of evidential breath testers that met NHTSA Model Specifications. The NHTSA tested these instruments at BAC levels of 0.010%, 0.020%, 0.030%, 0.040%, and 0.100%. Investigators repeated the tests 10 times and recorded the mean and standard deviation of the measurements. The results showed that six of the seven instruments demonstrated accuracy within NHTSA Model Specifications for evidential breath testers. It is noteworthy that the two instruments using fuel cells (Intoximeters Alco-Sensor III and an instrument from another manufacturer) showed greater accuracy at low BACs than the instruments using infrared techniques. The table below shows summary results for an Intoximeters, Inc. Alco-Sensor III, extracted from NHTSA Technical Note DOT 807 415, dated May 1989.
Alco-Sensor III Measurements at Simulated Low BACs
| Simulated BAC | 0.100 | 0.040 | 0.030 | 0.020 | 0.010 |
| Mean of 10 Readings | 0.099 | 0.040 | 0.030 | 0.021 | 0.011 |
| Standard Deviation | 0.0018 | 0.0005 | 0.0008 | 0.0000 | 0.0003 |
Fuel Cell Specificity For Alcohol
In the early 1990’s, investigators at the University of Tennessee at Memphis measured the response of fuel cell-based alcohol breath testing instruments to various substances1. These included many that might be expected to be present in the breath of individuals being tested. The instruments used in the study were the Intoximeters, Inc. Alco-Sensor III and Alco-Sensor IV. The people conducting tests introduced an accurately-measured sample into a heated cylinder filled with dry air. Then, they allowed gravity to move the piston to the bottom of the cylinder, passing the vapor sample through the Alco-Sensor’s mouthpiece. In both Phases I and II, the investigators used an Alco-Sensor III and an Alco-Sensor IV connected in series. Phase II used alcohol concentrations of 0.1 gm/dl to test the response of both instruments separately to ethanol, methanol, and isopropanol. The tables below show an abbreviated listing of the investigation’s results.
Stafford, David T. 1993. “Investigation of the Response of Fuel Cell Based Alcohol Breathtest Instruments to Substances Other Thank Ethanol.” Tennessee: University of Tennessee Toxicology Laboratory.
Phase I Test Results
| Substance | Vapor Concentration | Alco-Sensor III Response | Alco-Sensor IV Response |
| (mg/l) | (gm/dl) | (gm/dl) | |
| Acetaldehyde | 0.1 | 0.002 | 0.002 |
| Acetone | 0.1 | 0.0 | 0.0 |
| Acetonitrile | 0.1 | 0.0 | 0.0 |
| Benzene | 0.05 | 0.0 | 0.0 |
| 2-Butanol | 0.1 | 0.001 | 0.002 |
| Carbon Monoxide | 0.05 | 0.0 | 0.0 |
| Contact Cement | 0.06 | 0.0 | 0.0 |
| Cyclohexane | 0.1 | 0.0 | 0.0 |
| Diethylether | 0.1 | 0.0 | 0.0 |
| Ethylacetate | 0.06 | 0.0 | 0.0 |
| Gasoline | 0.1 | 0.0 | 0.002 |
| Isoprene | 0.1 | 0.002 | 0.002 |
| Isopropanol | 0.06 | 0.006 | 0.005 |
| Lacquer Thinner | 0.1 | 0.002 | 0.002 |
| Methane | 0.1 | 0.0 | 0.0 |
| Methanol | 0.04 | 0.009 | 0.008 |
| MEK | 0.06 | 0.0 | 0.0 |
| n-Pentane | 0.1 | 0.0 | 0.0 |
| n-Hexane | 0.1 | 0.0 | 0.0 |
| n-Heptane | 0.1 | 0.0 | 0.0 |
| n-Octane | 0.1 | 0.0 | 0.0 |
| Mineral Spirits Paint Thinner | 0.1 | 0.0 | 0.0 |
| Tetrachloroethylene | 0.05 | 0.0 | 0.0 |
| Toluene | 0.05 | 0.0 | 0.0 |
| 111-Trichlorethane | 0.1 | 0.0 | 0.0 |
| Trichlorethylene | 0.1 | 0.0 | 0.0 |
| Xylene | 0.1 | 0.0 | 0.0 |
Phase II Test Results
| Substance | Equivalent BAC | Alco-Sensor III Response | Alco-Sensor IV Response |
| Ethanol | 0.1 | 0.100 | 0.100 |
| Methanol | 0.1 | 0.043 | 0.047 |
| Isopropanol | 0.1 | 0.042 | 0.042 |
